
One website earned 72,200 Microsoft Copilot citations in 90 days and received 142 visits from AI assistants. That is one visit for every 508 citations, and one engaged visit for every 1,805. This case study measures the gap between AI visibility and AI referral traffic across three sites.
Many SEO teams believe a large share of AI referral traffic hides inside the Direct channel in Google Analytics 4. A user reads an AI answer, remembers the brand, and types the URL days later. Kevin Indig tested that idea in his Growth Memo study of 12 GA4 properties and found the growth in Direct traffic was mostly bots.
This case study goes one layer deeper. Instead of starting at the click, it follows AI traffic through all three stages: LLM crawlers fetching pages, AI answers citing them, and people clicking through. Each stage comes from a different first-party source, so each has different blind spots. The sites are anonymized. The numbers are not.
AI crawlers hit the site over half a million times a month, and the biggest consumers send no traffic back. Bing Copilot citations grew tenfold while Google's AI impressions stayed flat. Visits from AI assistants barely moved. A 41x Direct spike landed right after the citation peak, but the attributed AI channel stayed silent. AI visibility is real. AI clicks are rare. And Direct spikes are evidence to audit, not proof of hidden AI traffic.
The Data Sources Behind This Case Study
The main site is a content-led website with a large blog. Two smaller sites serve as contrasts later in the post. Bing and GA4 cover the exact same window, so the citation to click ratio compares like with like.
| Stage | Source | What it measures | Window |
|---|---|---|---|
| Crawl | Cloudflare AI Crawl Control | Requests from AI crawlers, by operator and user agent | 30 days to 22 Oct 2026 |
| Cite | Bing Webmaster Tools, AI Performance | Citations in Microsoft Copilot and partners | 16 Jul to 15 Oct 2026 |
| Cite | Google Search Console, Generative AI features | Impressions in Google's AI surfaces, including AI Overviews | 3 months to Oct 2026 |
| Click | GA4, AI Assistant channel | Sessions with an AI assistant referrer | 16 Jul to 15 Oct 2026 |
Limitation: Cloudflare keeps 30 days of AI crawler data on this plan, so crawl figures are read as a monthly rate rather than a matched 90-day total.
Stage 1: AI Crawlers Took 528,000 Requests in 30 Days
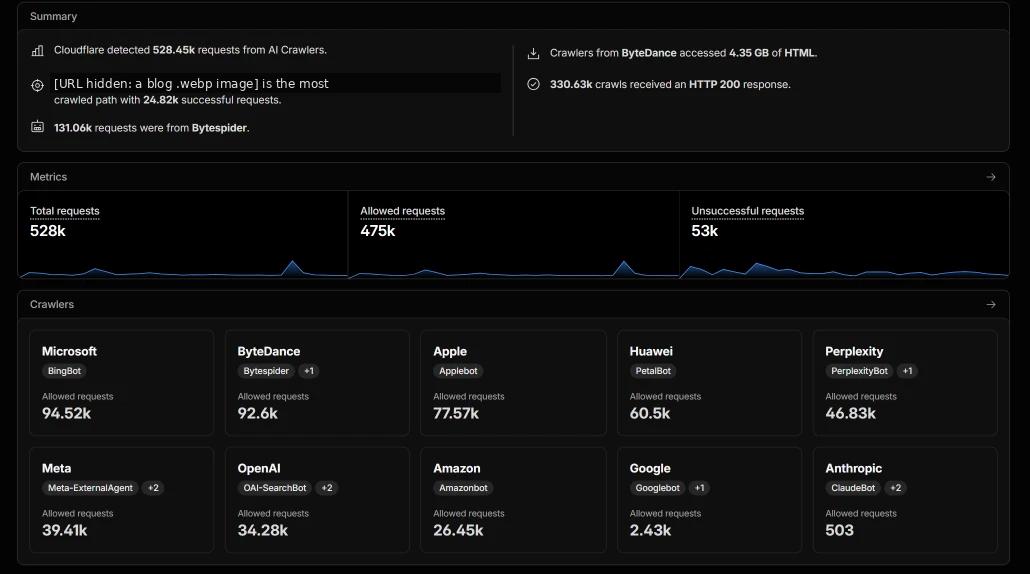
Cloudflare logged 528,450 requests from AI crawlers in 30 days. Of those, 475,000 were allowed, 53,000 were unsuccessful, and 330,630 returned an HTTP 200. Only about 63% of AI crawler requests received a clean, successful response. To set up the same report and check it against your robots.txt rules, see Cloudflare AI crawler monitoring.
| Operator | Crawler user agent | Allowed requests | Sends referral traffic? |
|---|---|---|---|
| Microsoft | Bingbot | 94,520 | Yes |
| ByteDance | Bytespider (+1) | 92,600 | No |
| Apple | Applebot | 77,570 | Minimal |
| Huawei | PetalBot | 60,500 | No |
| Perplexity | PerplexityBot (+1) | 46,830 | Yes |
| Meta | Meta-ExternalAgent (+2) | 39,410 | No |
| OpenAI | OAI-SearchBot (+2) | 34,280 | Yes |
| Amazon | Amazonbot | 26,450 | Minimal |
| Googlebot (+1) | 2,430 | Yes | |
| Anthropic | ClaudeBot (+2) | 503 | Minimal |
The biggest takers send nothing back
Bytespider alone made 131,060 requests and downloaded 4.35 GB of HTML. ByteDance runs no AI search product that sends meaningful referral traffic to most websites. PetalBot added another 60,500 requests on the same terms. If you are deciding which LLM crawlers to allow in robots.txt, compare each crawler's request volume against the referral sessions it produces. Our guide to AI crawlers vs traditional search crawlers explains how each type uses your pages.
Bingbot leads, and it shows up downstream
Microsoft's 94,520 allowed requests are the most of any operator. That lines up with the site's Copilot citation volume in Stage 2, the clearest crawl to citation link in the data.
The most crawled URL is an image
A single blog .webp file received 24,820 successful requests, more than any article. AI crawlers spend a surprising share of their crawl budget on media files, not just text.
About the Google figure: Cloudflare's 2,430 Google requests likely cover only Google's AI-related fetches, not regular Googlebot crawling. Do not read it as total Google crawl activity.
Stage 2: Copilot Citations Grew Tenfold, Google AI Impressions Stayed Flat
Bing's AI Performance report credited the site with 72,200 citations between 16 July and 15 October, across an average of 153 cited pages per day.
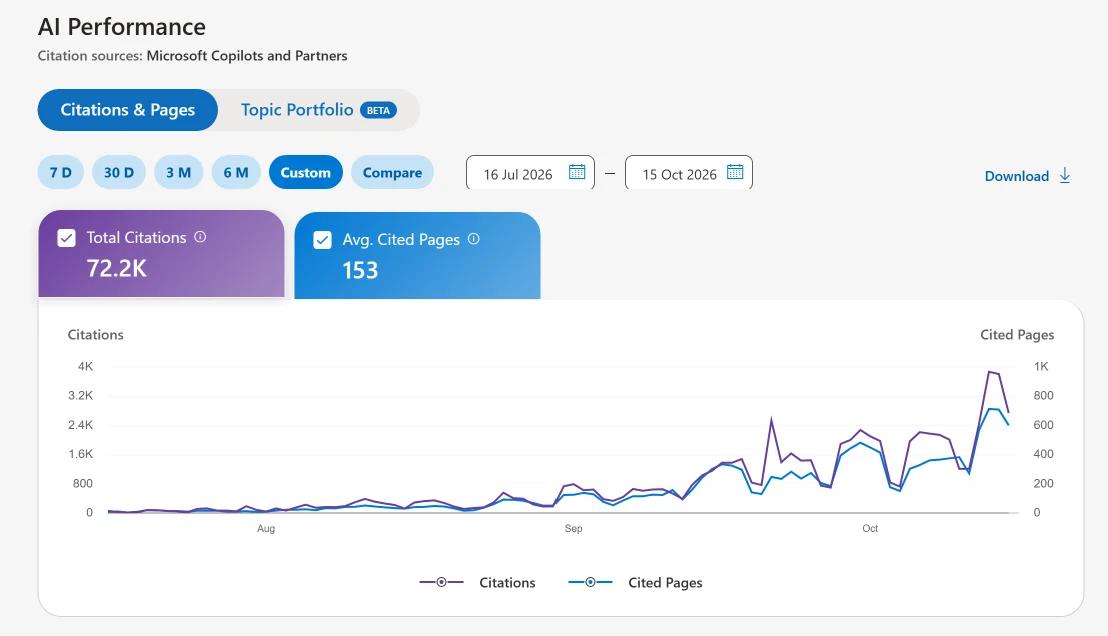
The growth was sharp and late. Daily citations stayed under about 400 through August. From mid-September they climbed to between 1,000 and 2,400 a day, then peaked near 3,900 around 12 and 13 October. Cited pages rose in step, from under 100 a day to over 700 at the peak.
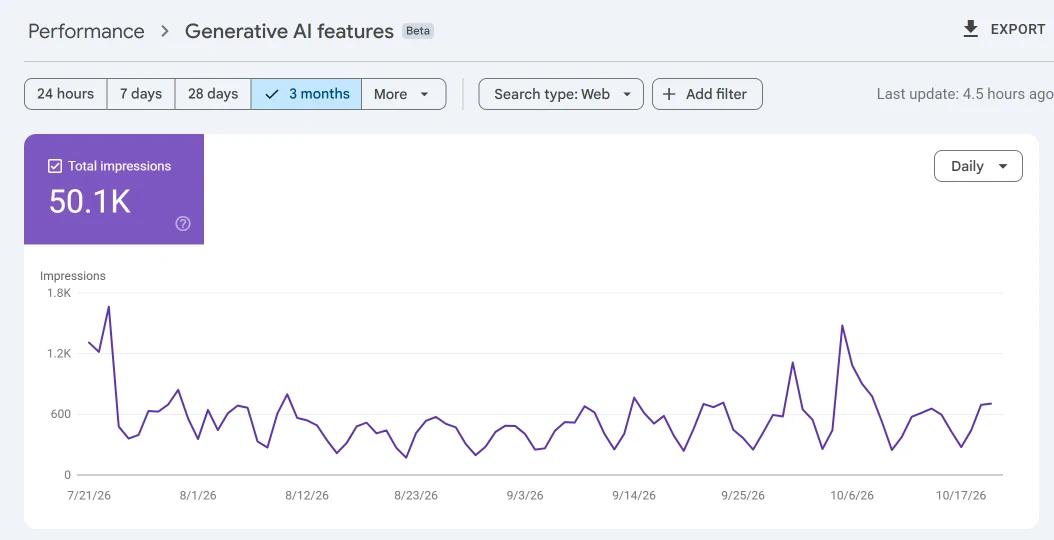
Google told a different story. Search Console's Generative AI features report showed 50,100 impressions over three months with no upward trend. Impressions spiked to about 1,700 in late July, settled mostly between 300 and 700 a day, and spiked again to about 1,500 around 4 October.
Citations rose roughly tenfold, from under 400 a day to a 3,900 peak.
Impressions stayed flat, mostly 300 to 700 a day, with no growth trend.
AI visibility is not one number. On the same site, over the same period, one platform rose tenfold while the other stayed flat. Track each platform separately, and never assume one trend applies to the other.
Stage 3: 142 AI Visits, 40 of Them Engaged
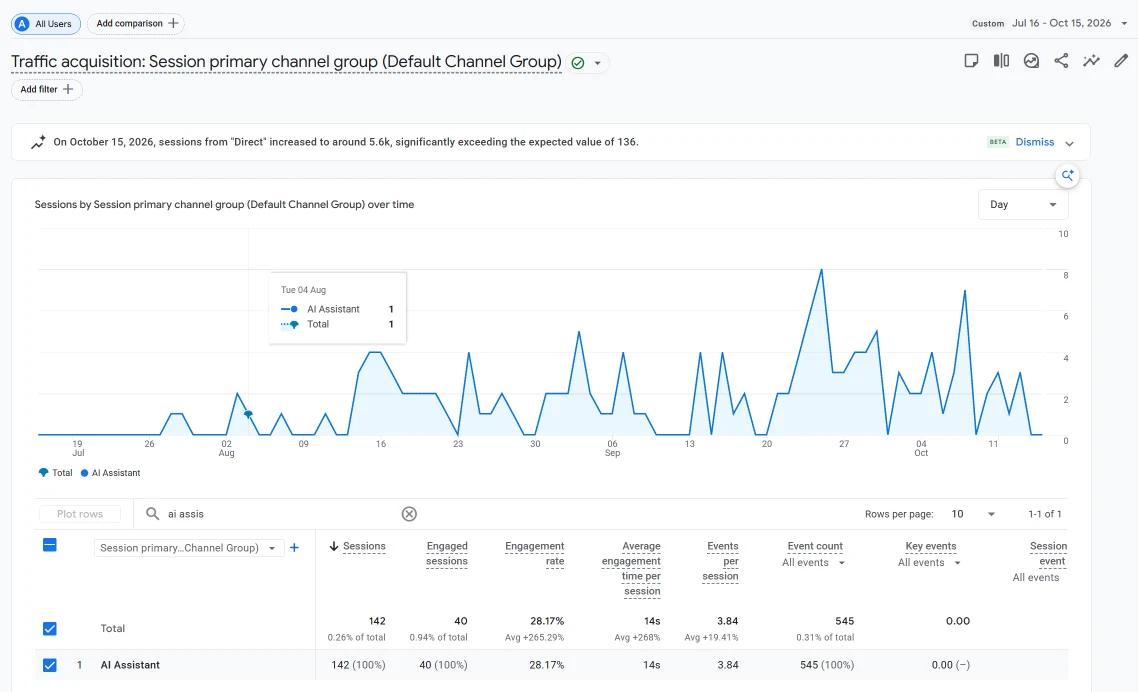
GA4's AI Assistant channel recorded 142 sessions in the same 16 July to 15 October window.
| Metric | 16 Jul to 15 Oct 2026 |
|---|---|
| Copilot citations | 72,200 |
| AI Assistant sessions | 142 |
| Engaged sessions | 40 |
| Engagement rate | 28.17% |
| Average engagement time | 14 seconds |
| Citations per session | About 508 |
| Citations per engaged session | About 1,805 |
Citations grew roughly tenfold. AI sessions did not. They rose from mostly zero in July to typically two to five a day, with a single high of eight around 25 September. On 12 and 13 October, the days Copilot citations peaked, AI sessions were near zero. This is what zero-click searches look like inside an AI answer: the citation satisfies the user, and the click never happens.
The following week confirms the gap. Extending the range to 22 October added about 7,100 citations and 22 sessions, roughly 320 citations per visit.
The 15 October Direct Spike: AI Traffic or Bots?
On 15 October, GA4 flagged an anomaly: Direct sessions jumped to about 5,600 against an expected 136. That is a 41x spike, landing two days after Copilot citations peaked.
It is exactly the pattern people hope to find. AI exposure peaks, then brand recall visitors arrive with no referrer. Three signals argue against it.
| Status | Signal |
|---|---|
| Confirmed | The attributed AI Assistant channel did not move on the same days |
| Confirmed | 5,600 sessions in one day is about 40 times the site's entire 90-day AI Assistant total |
| Unlikely | Brand recall arriving in a single day. Similarweb research cited by Growth Memo found AI-influenced visits spread over seven days, mostly through Search |
| Unknown | Which browser, operating system and screen resolution the spike came from |
[PLACEHOLDER: add the 15 October Direct breakdown] Browser, operating system, screen resolution, country, and engaged sessions. If the spike concentrates in one configuration with near-zero engagement, state it as bot traffic. Also check whether the spike in Cloudflare's total requests chart falls on the same date.
Some headless crawlers execute JavaScript. They fire GA4 tags and land in Direct with no referrer, which makes a crawler spike a likely explanation for a Direct spike. Blocking or challenging them often triggers the next problem, so learn how to fix 403 errors blocking AI crawlers before tightening bot rules.
Two Smaller Sites: Fewer Citations, Ten Times the Click Rate
Two smaller sites earned far fewer citations but turned more of them into visits. One of them is a small ecommerce merch store. All three are compared on the same 16 July to 15 October window except where noted.
| Metric | Main site | Contrast site B | Merch store |
|---|---|---|---|
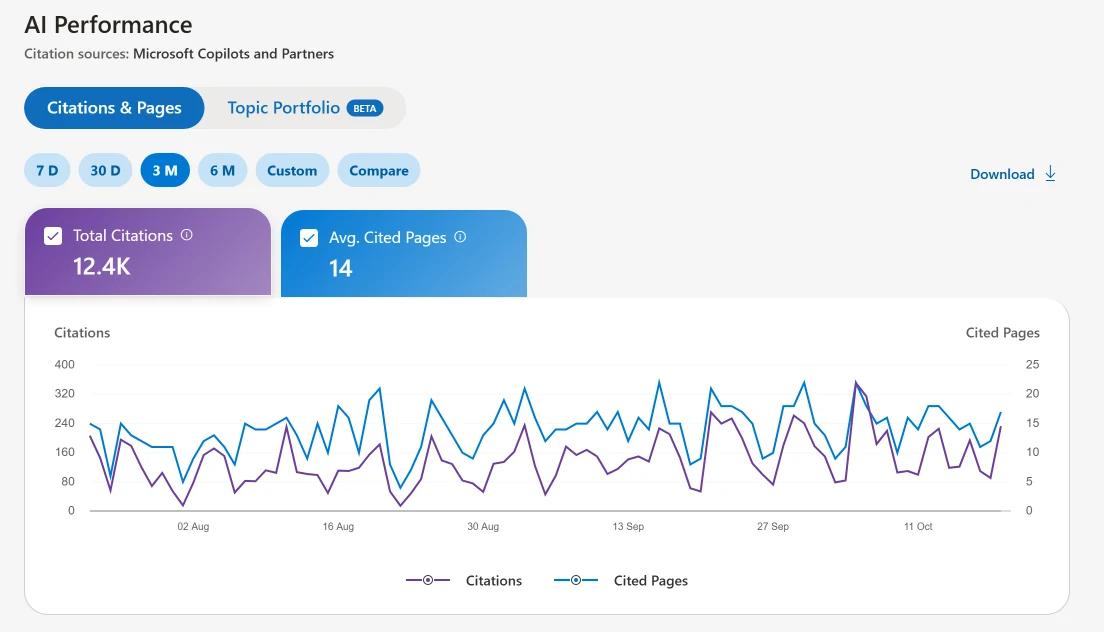
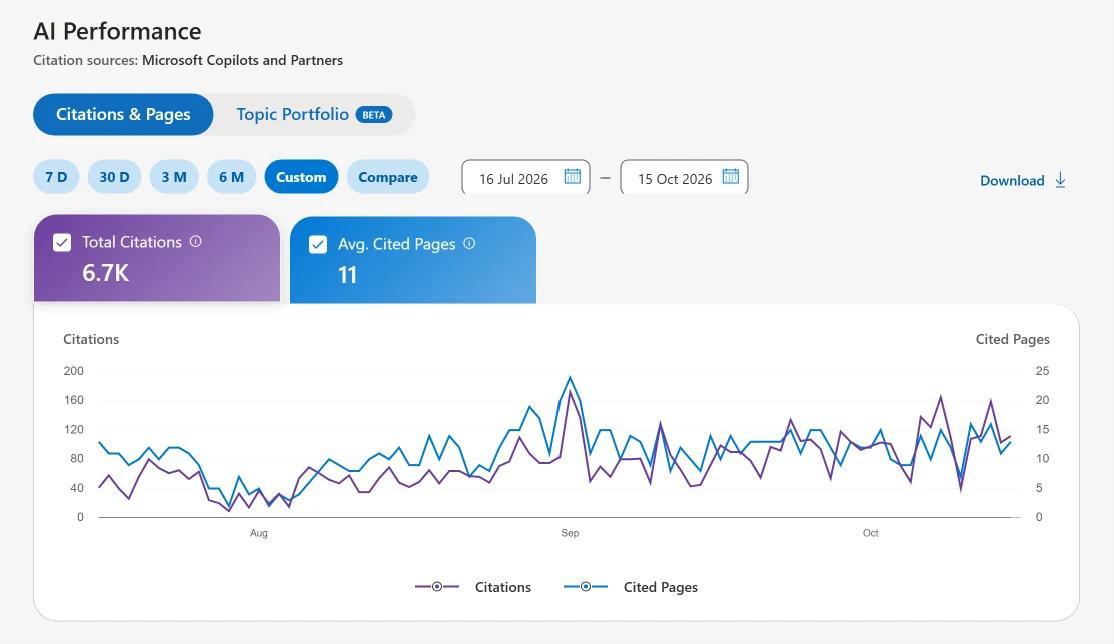
| Copilot citations | 72,200 | 12,400* | 6,700 |
| Average cited pages | 153 | 14* | 11 |
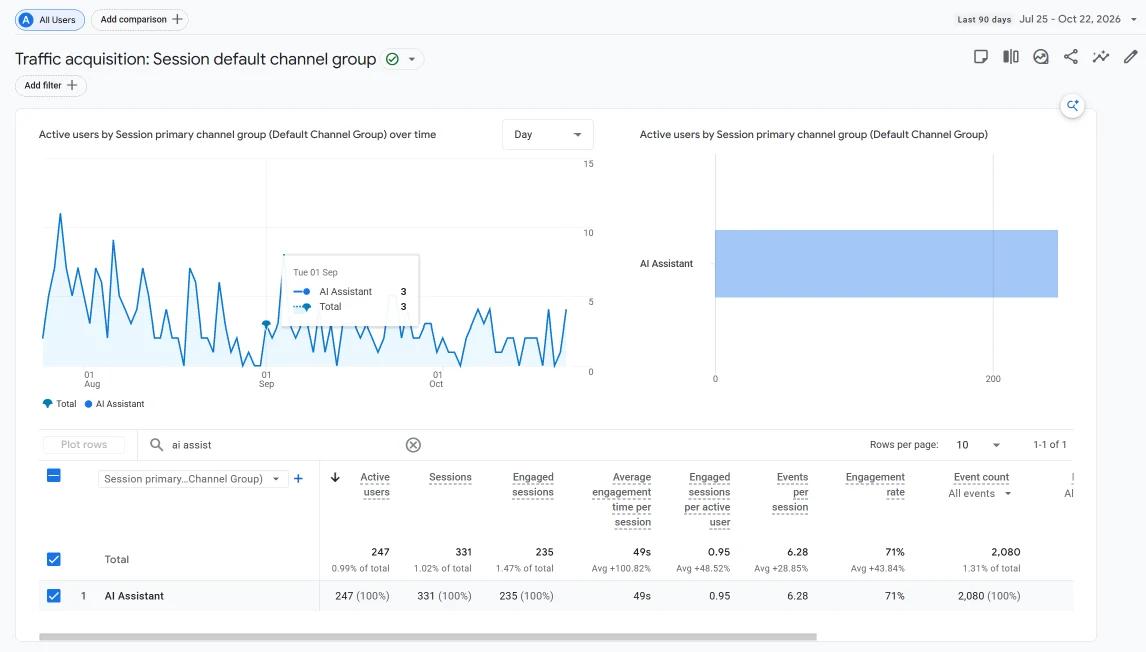
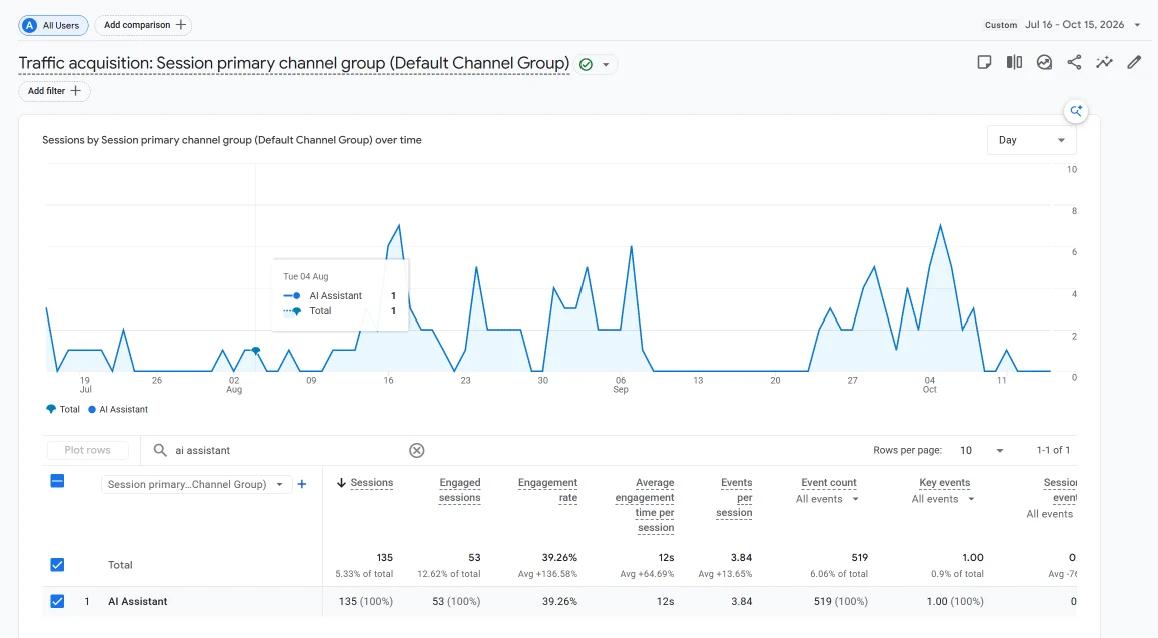
| AI Assistant sessions | 142 | 331* | 135 |
| Engagement rate | 28.17% | 71%* | 39.26% |
| Average engagement time | 14 seconds | 49 seconds* | 12 seconds |
| Visits per 100 citations | About 0.2 | About 2.7* | About 2.0 |
| AI share of all sessions | 0.26% | 1.02%* | 5.33% |
*Contrast site B uses a 90-day window ending 22 October 2026.
Concentrated citations click better
The two smaller sites have citations spread over 11 to 14 pages and earn about 2 to 2.7 visits per 100 citations. The main site spreads citations across 153 pages and earns about 0.2. One reading: a few pages that answer a specific question get cited where the user still needs to click, while broad citation coverage often satisfies the user inside the AI answer. Three sites make the pattern more convincing, but not proven.
The platform pattern flipped
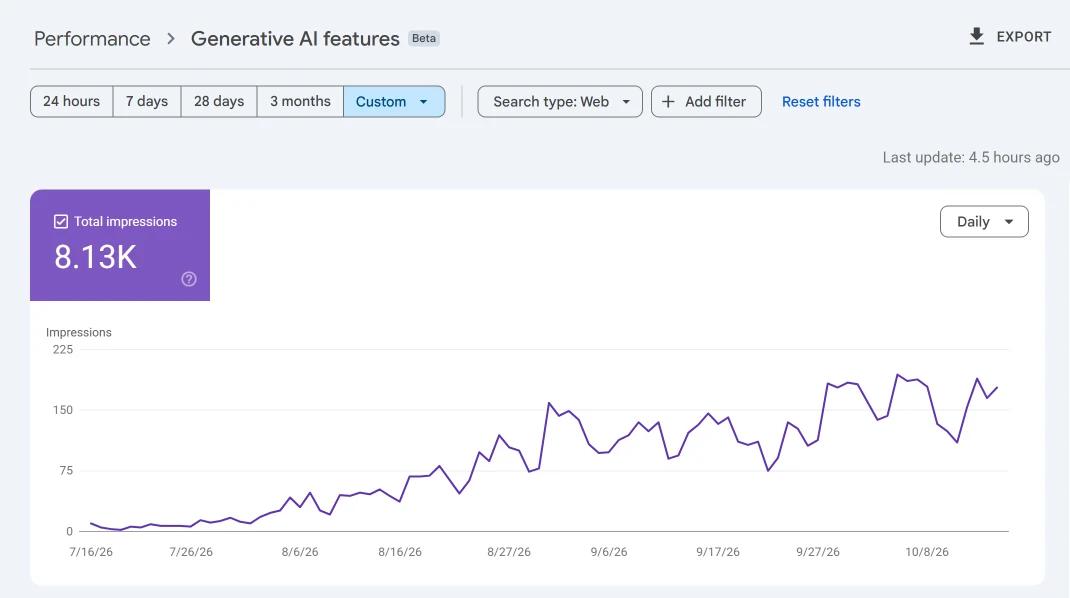
On the merch store, Google AI feature impressions climbed steadily from under 10 a day in mid-July to 150 to 190 a day by October, 8,130 in total. Copilot citations rose more modestly, from about 40 to 80 a day to 100 to 200. That is the reverse of the main site, where Bing rose tenfold and Google stayed flat.
Bing Copilot citations rose tenfold. Google AI impressions stayed flat.
Google AI impressions rose about twentyfold. Bing Copilot grew modestly.
AI matters more to small sites
AI Assistant sessions made up 5.33% of all sessions on the merch store, against 0.26% on the main site. It also recorded the only key event from an AI session in the data: one conversion. One event is not a trend, but it shows where to look next.
[PLACEHOLDER] Confirm contrast site B's matched 16 July to 15 October figures, so all three columns share one window.
How to Measure AI Traffic on Your Own Site
No single tool shows the full path from crawl to click. Combine them, and read each stage for what it can and cannot tell you.
- Review AI crawlers by operatorUse Cloudflare or your server logs. Compare request volume per user agent against referral sessions from the same operator, then decide which crawlers earn access. Start with checking crawlability for Google, Bing, and AI bots.
- Fix non-200 responsesOnly 63% of AI crawler requests here returned a 200. A technical SEO audit finds redirect chains, 5xx errors and blocked resources that waste crawl budget. If crawlers hit rate limits, see the HTTP 429 rate limiting guide.
- Track citations per platformWatch Bing AI Performance and Search Console's Generative AI features separately.
- Report engaged sessions, not just sessionsUse GA4's AI Assistant channel and always show engaged sessions next to total sessions. Our guide on how to track AI referral traffic in GA4 covers the setup.
- Audit Direct spikes before celebratingBreak them down by day, landing page, browser, operating system, screen resolution and country. Clusters with one configuration and no engagement are bots.
- Ask customersAdd "How did you hear about us?" to forms. Self-reported attribution is the only way to catch AI influence that never clicks.
For the full list of on-site checks that make pages easier to cite, work through the AI Search SEO Checklist.
Key Findings
- 72,200 Copilot citations produced 142 AI visits, about 508 citations per visit.
- AI crawlers made 528,450 requests in 30 days. Two of the largest, Bytespider and PetalBot, send no meaningful traffic back.
- Copilot citations grew tenfold while Google AI impressions stayed flat.
- A 41x Direct spike followed the citation peak, but the attributed AI channel did not move.
- Two sites with 11 to 14 cited pages earned about ten times the click rate of one with 153.
- Platforms diverge by site: Bing grew tenfold on one, Google AI impressions grew about twentyfold on another.
FAQ
- Does AI drive direct traffic?
- Not in a way this data could detect. The largest Direct spike followed a citation peak, but the attributed AI channel stayed flat, which points to bots rather than brand recall.
- What is a good citation to click ratio?
- There is no benchmark yet. Across three sites in this case study it ranged from about 0.2 to 2.7 visits per 100 citations.
- Should I block Bytespider in robots.txt?
- If it uses significant bandwidth and sends no referral traffic, blocking is reasonable. Here it pulled 4.35 GB of HTML in 30 days.
- Where do I find AI citation data?
- Bing Webmaster Tools has an AI Performance report for Copilot citations. Google Search Console reports Generative AI features impressions under Performance.
- Why does GA4 show AI traffic in Direct?
- Some AI apps strip the referrer, and some headless crawlers run JavaScript and fire GA4 tags. Both land in Direct, so a Direct spike needs a breakdown before you credit it to AI.
Data: anonymized Cloudflare, Bing Webmaster Tools, Google Search Console and GA4 measurements from three sites, July to October 2026. Brands and domains withheld. Background research: Kevin Indig, "Does AI drive more direct traffic?", Growth Memo, 19 October 2026.